
VIIRS Ice Surface Temperature Product Validation
Version 1 Validation Statement
Validation at stage 1 has been achieved for the NASA VIIRS Ice Surface Temperature (IST) (VNP30) product. IST measurements during NASA’s IceBridge campaign are compared to the VIIRS/NPP Ice Surface Temperature 6-Min L2 Swath 750m, Version 2, which is publicly available at NASA NSIDC.
During the IceBridge campaign, a KT-19 nadir-pointing radiometer was mounted on the underside of a P-3 aircraft to measure radiometric surface temperature. On April 6, 2019, the NASA P-3 flew from Thule, Greenland to the Northwest, crossing the Canadian Archipelago and a part of the Arctic Ocean, eventually aligning with an ICESat-2 overpass (Figure 1). The acquired KT-19 data are used here to compare with the VIIRS IST (VNP30) product.
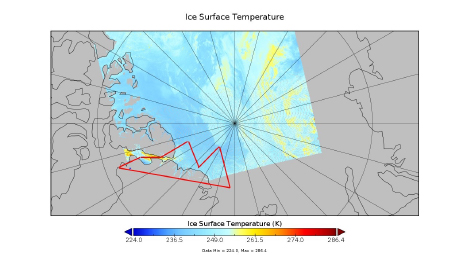
Figure 1. Figure 1. Counterclockwise flight track (red) of NASA’s P3 on April 6, 2019, overlaying on the NASA VNP30 IST product.
The surface temperature acquired by the KT-19 over sea ice along the flight path is compared to the coincident IST from the NASA VNP30 product (Figure 2).
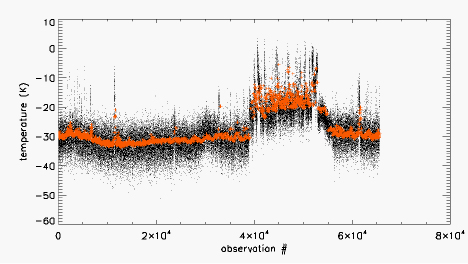
Figure 2. NASA VNP30 IST (orange) and the coincident IceBridge KT-19 measured surface temperature (black).
It is evident from Figure 2 that the VNP30 IST product compares favorably to the IST acquired by the KT-19 during the IceBridge flight. The mean IST for the VNP30 IST was 245.72K; for the KT-19, 244.94K. Standard deviations were 5.79K and 7.07K, respectively.
Support Studies
Studinger, M., 2020. IceBridge KT19 IR Surface Temperature, Version 2 [Data Set]. Boulder, Colorado USA. NASA National Snow
and Ice Data Center Distributed Active Archive Center. https://doi.org/10.5067/UHE07J35I3NB.
Tschudi, M., G. Riggs, D. K. Hall, and M. O. Román. 2017. VIIRS/NPP Ice Surface Temperature 6-Min L2 Swath 750m Products:
A Consistent and High Quality Earth System Data Record, IEEE TGRS, doi: 10.1109/JSTARS.2017.2779330.