
VIIRS NASA Vegetation Index Product Validation
Version 1 Product Validation Statement
Validation at stage 1 has been achieved for the VIIRS Vegetation Index (VI) product suite
The VIIRS VIs are retrieved from daily, atmosphere-corrected, bidirectional surface reflectance data. They are generated at 16-day intervals using a VIIRS compositing algorithm inherited from EOS-MODIS and based on product quality assurance to remove low quality pixels and constrain the viewing geometry to reduce BRDF effects. The algorithm selects one day to represent the compositing period and two 16-day data streams are actually produced 8 days apart to mimic the Terra/Aqua MODIS data streams and assist users during the transition by providing MODIS like data records. The VIIRS product suite is designed to continue the MODIS records and serve the terrestrial ecosystem, climate, natural resources management, and operational research as demonstrated by the large body of VI based peer reviewed publications.
Accuracy is now within ± 5-10% VI units under ideal atmosphere conditions. This represents the ability of the 16-day VI products to retrieve a top of canopy (TOC) VI value when observations are of high quality (clear, no sub pixel cloud, low aerosol, and sensor view angle < 30 degrees). These estimates are based on indirect data evaluation ranging from comparisons with AERONET- corrected data (from different biomes and seasons) to across sensors comparisons, especially with MODIS.
The NDVI accuracy is generally within ± 5 % (0.05 absolute VI units), while that of the enhanced VI (EVI/EVI2) is slightly higher at ± 5-10% (0.05-0.1) due to the blue band performance, with EVI2 slightly performing better than EVI since it does not rely on the blue band.
Errors in the red band (less for the NIR band) associated with residual atmospheric effects remain the major source of VI errors. When the per-pixel quality information is uncertain or erroneous (omission or commission errors) the overall NDVI and EVI errors increase to about 0.05-0.2 (VI units) particularly over biomes prone to extensive period of cloud and smoke/aerosols cover. This larger error envelope captures the error sources (sensor, atmosphere correction, processing issues, uncertainty in quality) and as such is the more general global error envelope for the VIIRS VI time series.
Forward-scatter pixels may be preferentially selected leading to a small positive bias (+0.020) in NDVI, but insignificant in the EVI values. All VI values are computed in the same way in time and space, regardless of land cover and soil type, and represent true surface measurements (not modeled, no assumptions, full traceability to sensors observations) which supports direct validation. For most cloud- and snow-free pixels with low aerosol load, the VI values are usually very accurate, however, for cases of no pixels with acceptable quality available within a compositing period, a lower quality maximum NDVI will be chosen to gap-fill the pixel. We are working on a VIIRS VI gap-filling algorithm based on statistical interpolation to guarantee high quality data.
The EVI product is particularly sensitive to coherent inter-band (blue, red and NIR) atmospheric correction and thus may become unstable over extreme bright or dark surfaces, such as snow/subpixel clouds, desert playas, and inland water bodies, where the EVI values are usually problematic. The VIIRS product suite generates a second EVI2 (2-bands) time series that is identical to- and outperforms EVI (3-bands) when sub-pixel aerosols and snow/ice exist.
Analyses from various airborne and field validation campaigns (especially with NEON AOP hyperspectral data, AVIIRS, Landsat ETM/ETM/OLI, and multispectral drone data) show that over most biomes, VIIRS, like MODIS, near-nadir VI values have good agreement with top-of-canopy (TOC) nadir VI and with land surface biophysical properties. Comparisons of seasonal flux tower (FLUXNET) measurements of gross primary production show very strong agreement across a global set of biome types with VIs (from MODIS and are expected to be the same from VIIRS too). Overall VIIRS VI time series is very consistent and highly similar to MODIS VI time series which supports across sensors continuity and multi-sensor data use.
Users are highly advised to examine the per-pixel product quality assurance (QA) information to screen poor quality data before use in applications, science, or research. Poor quality inputs to the VI algorithm usually result in abnormally low VI values, however, anomalous high values may also occur, particularly with the EVI over snow and cloud and NDVI and EVI near or over water bodies.
The following figures show the spatial distribution of the Accuracy, Precision, and Error of VIIRS NDVI and EVI2 (EVI), on the left and right, respectively. The error was computed using data from Aeronet sites and an error transfer model from input surface reflectances to VI space. The second series of figures illustrate the continuity of VIIRS and MODIS VI data record.
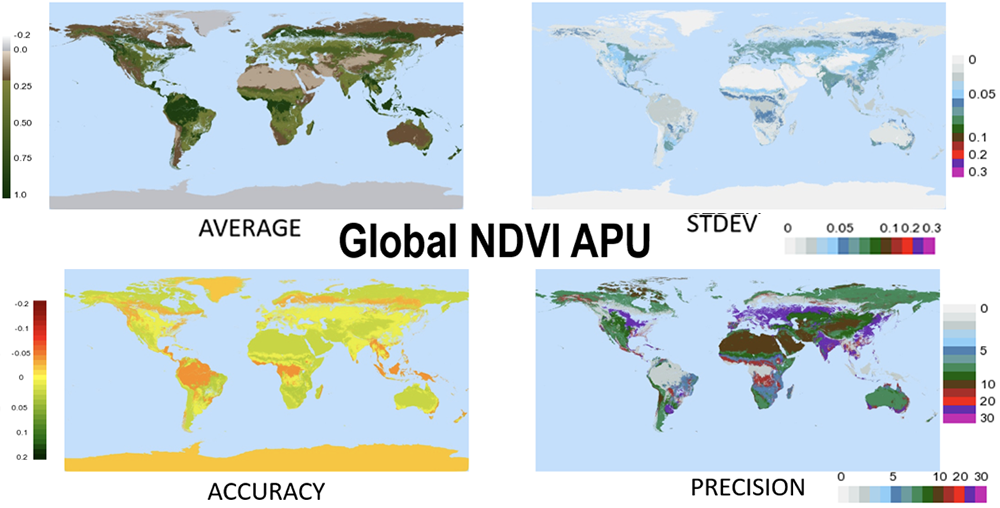
Global distribution of VIIRS NDVI Accuracy, Precision, and Uncertainty. Click on
image to see larger version.
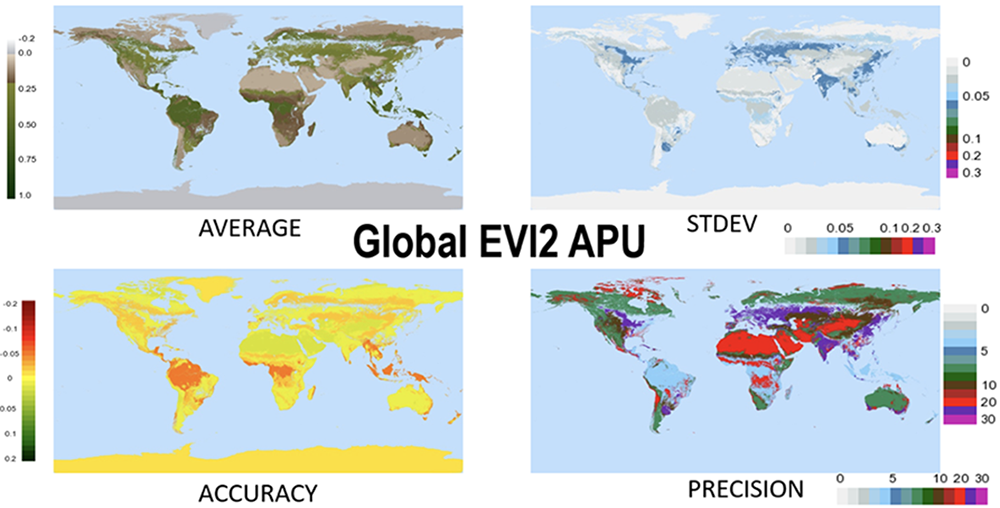
Global distribution of VIIRS EVI Accuracy, Precision, and Uncertainty. Click on
image to see larger version.
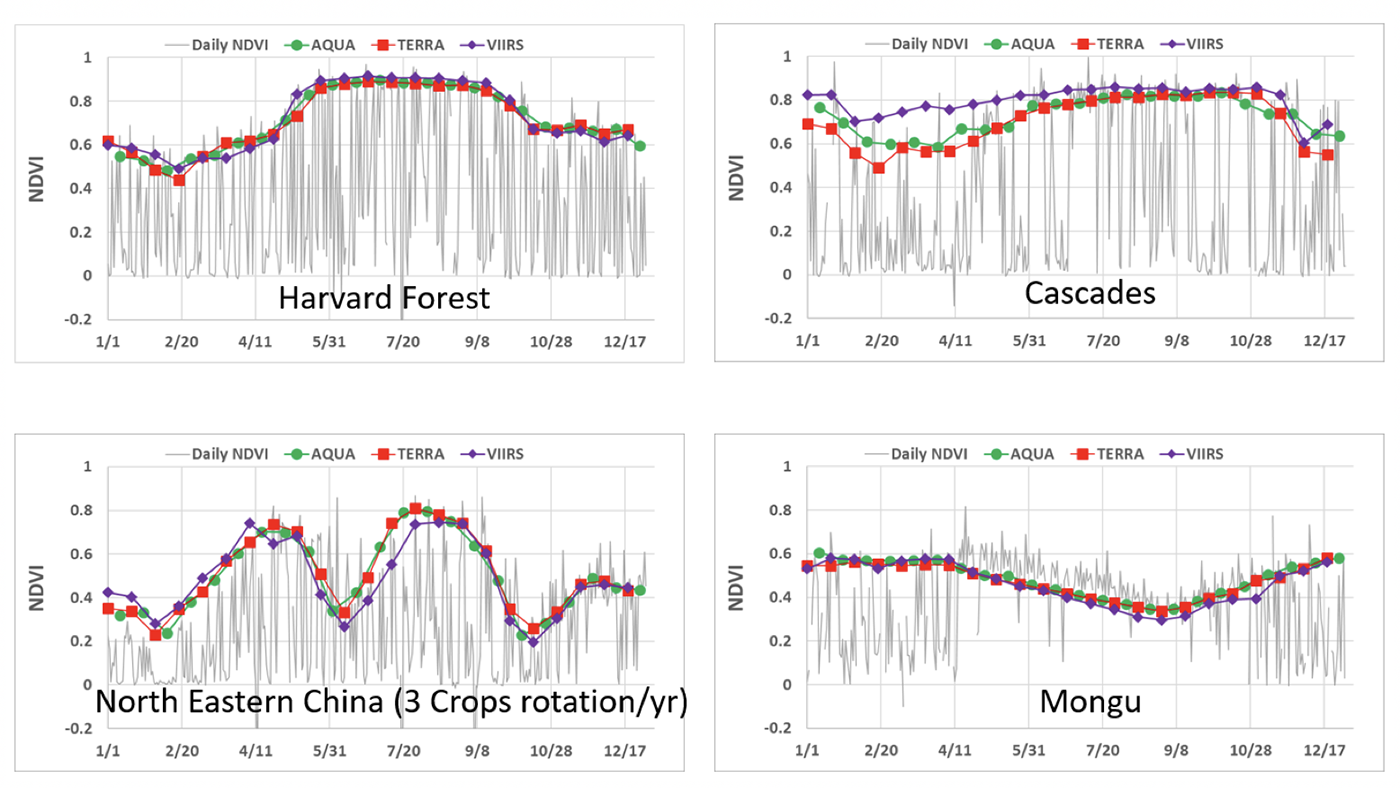
NDVI, EVI, and EVI2 across sensors temporal profiles performance. Click on image to see
larger version.
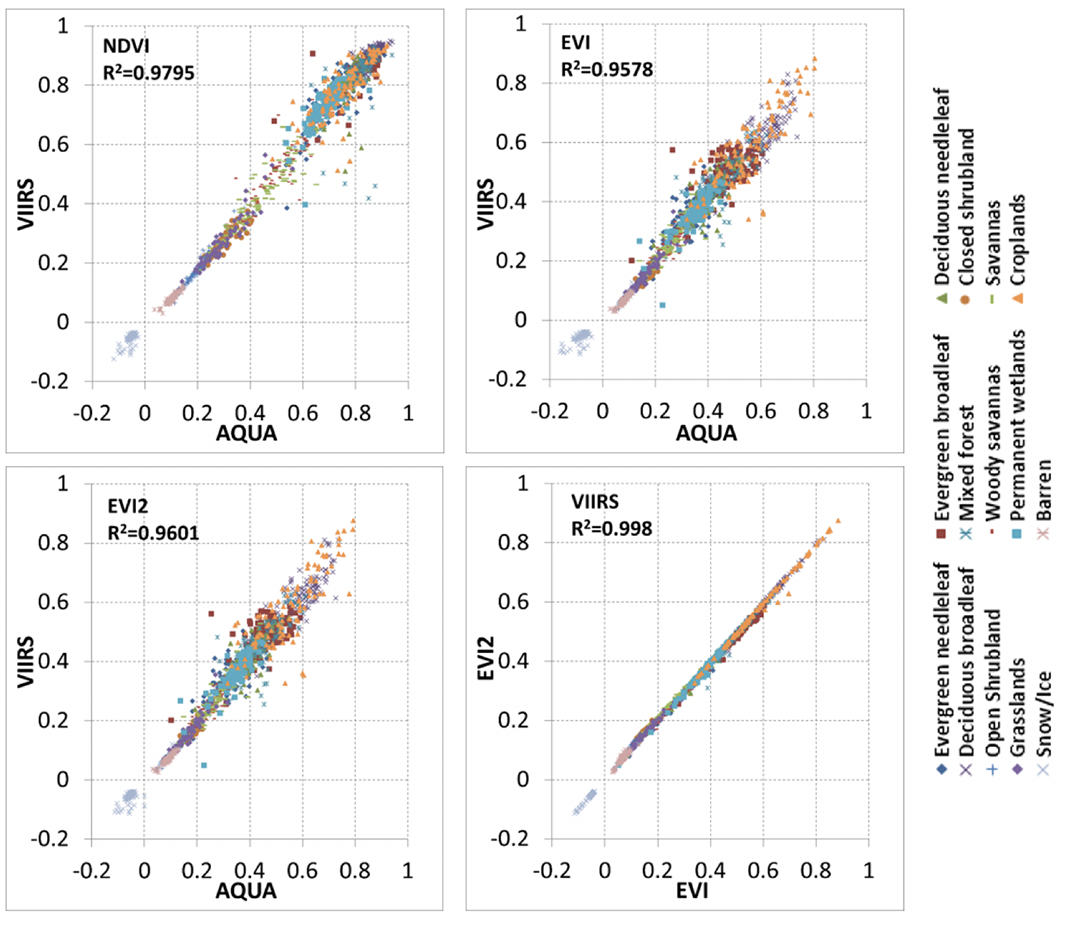
NDVI, EVI, and EVI2 across sensors continuity. Click on image to
see larger version.
Supporting Studies
Jarchow CJ, Didan K, Barreto-Muñoz A, Nagler PL, Glenn EP, (2018). Application and Comparison of the MODIS-Derived Enhanced Vegetation Index to VIIRS, Landsat 5 TM and Landsat 8 OLI Platforms: A Case Study in the Arid Colorado River Delta, Mexico, Sensors 2018 May 13;18(5):1546, https://doi.org/10.3390/s18051546
Skakun S, Justice CO, Vermote E, Roger JC. Transitioning from MODIS to VIIRS: an analysis of inter-consistency of NDVI data sets for agricultural monitoring. International Journal of Remote Sensing. 2018 Feb 16;39(4):971-92.
Obata, K., Miura, T., Yoshioka, H., Huete, A. R., & Vargas, M. (2016). Spectral cross-calibration of VIIRS enhanced vegetation index with modis: A case study using year-long global data. Remote Sensing, 8(1), 34.
Shabanov, N., Vargas, M., Miura, T., Sei, A., & Danial, A. (2015). Evaluation of the performance of Suomi NPP VIIRS top of canopy vegetation indices over AERONET sites. Remote Sensing of Environment, 162, 29-44.
Wang, J., Miura, T., Kato, A., Blanken, P. D., Brunsell, N., & Torn, M. S. (2014, July). Radiometric validation of satellite vegetation indices using flux tower measurements. In Geoscience and Remote Sensing Symposium (IGARSS), 2014 IEEE International(pp. 2383-2386). IEEE.
Vargas, M., Miura, T., Shabanov, N., & Kato, A. (2013). An initial assessment of Suomi NPP VIIRS vegetation index EDR. Journal of Geophysical Research: Atmospheres, 118(22).