
VIIRS NASA Snow Cover Product Validation
Collection 2 Validation Statement
The NASA VIIRS snow cover product VNP10 is at Stage 3 validation.
The VIIRS snow cover product has been compared with the MODIS snow cover product to estimate accuracy. The accuracy of the MODIS snow cover product has been assessed at around 93% for detection of snow cover as reported in various peer-reviewed publications over the past 23 years. That accuracy applies to the most favorable viewing conditions of clear sky, near nadir, and snow depth greater than about 2 cm. The accuracy of the MODIS snow cover product varies with land cover type, viewing geometry, and cloud conditions, factors that should be considered when using the snow cover product. The accuracy of the VIIRS snow cover product is estimated to be about 93% based on comparison with MODIS snow cover product.
Continuity is very good between VIIRS and MODIS. Investigations of continuity between VIIRS and MODIS daily snow cover products have found consistency in snow cover extent spatially and temporally between VIIRS and MODIS on daily and yearly time scales. Continuity is observed in comparison of daily MODIS and VIIRS snow cover products as shown in the comparison below.

MODIS Terra (MOD10A1), Aqua (MYD10A1), VIIRS SNPP (VNP10A1) and NOAA-20 (VJ110A1) snow cover maps from 15 March 2023, tile h12v04. The extent of snow cover is very similar in all four products, but the extent of cloud cover is different because of differences in satellite acquisition times and cloud masking.
Investigations of continuity between VIIRS and MODIS daily snow cover products over a water year show that the MODIS and VIIRS snow cover extents are nearly the same day-to-day and both track the changes in snow cover over the year. Continuity between the MODIS Terra and VIIRS SNPP daily cloud-gap-filled products for water year 2020 in the Great Basin, western United States, is shown below.
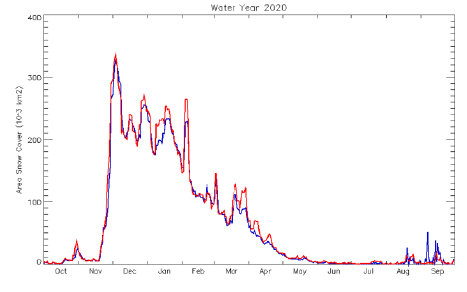
Snow cover area tracked over the water year 2020 for the Great Basin in the western US. Very good continuity between MOD10A1F (blue) and VNP10A1F (red) is seen over the snow season. Snow cover accumulation and melt dates are nearly the same for MODIS and VIIRS. On some days during the snow season VIIRS observed more snow cover than MODIS which is attributed to differences in acquisition times and cloud masking differences.
The limited peer-reviewed research on continuity between VIIRS and MODIS reports 95% or greater agreement in snow cover between VIIRS and MODIS. Detection of snow can be affected by differences in cloud cover masking between VIIRS and MODIS because of differences in the cloud mask algorithms and changes in cloud cover between acquisition times.
Validation and continuity research use the Level-3 VNP10A1 product. The VNP10A1 product is the Level-2 VNP10 snow cover product projected to the sinusoidal projection; thus, the accuracy applies to both the VNP10 and VNP10A1 products. Accuracy of the daily cloud-gap-filled product, VNP10A1F, may be affected by temporal factors and the daily climate modeling grid (CMG) product, VNP10C1, may be affected by spatial sampling factors. However, significant deviations in accuracy have not been observed in those higher-level products.
Support Studies
Miguel O. Román, Chris Justice, Ian Paynter, Peter B. Boucher, Sadashiva Devadiga, Arthur Endsley, Angela Erb, Mark Friedl,
Huilin Gao, Louis Giglio, Josh M. Gray, Dorothy Hall, Glynn Hulley, John Kimball, Yuri Knyazikhin, Alexei Lyapustin,
Ranga B. Myneni, Praveen Noojipady, Jiabin Pu, George Riggs, Sudipta Sarkar, Crystal Schaaf, Deep Shah, Khuong H. Tran,
Eric Vermote, Dongdong Wang, Zhuosen Wang, Aisheng Wu, Yongchang Ye, Yu Shen, Shuai Zhang, Shuai Zhang,
Xiaoyang Zhang, Maosheng Zhao, Carol Davidson, Robert Wolfe, Continuity between NASA MODIS Collection 6.1 and VIIRS
Collection 2 land products, Remote Sensing of Environment, 2024,Volume 302, 113963, https://doi.org/10.1016/j.rse.2023.113963.
Liu, A.; Che, T.; Huang, X.; Dai, L.; Wang, J.; Deng, J. Effect of Cloud Mask on the Consistency of Snow Cover Products from
MODIS and VIIRS. Remote Sens. 2022, 14, 6134. https://doi.org/10.3390/rs14236134
Riggs, G.A. and D.K. Hall, 2020: Continuity of MODIS and VIIRS snow cover extent data products for development of an Earth
Science Data Record, Remote Sensing, 12:3781.
Hall, D. K., Riggs, G. A., DiGirolamo, N. E., and Román, M. O. Evaluation of MODIS and VIIRS cloud-gap-filled snow-cover
products for production of an Earth science data record, Hydrology and Earth System Sciences, 2019, 23:5227-5241,
https://doi.org/10.5194/hess-23-5227-2019.
Thapa, S.; Chhetri, P.K.; Klein, A.G. Cross-Comparison between MODIS and VIIRS Snow Cover Products for the 2016
Hydrological Year. Climate 2019, 7, 57. https://doi.org/10.3390/cli7040057