
VIIRS Land Surface Phenology (LSP) Product Validation
Version 1 Validation Statement
Validation at stage 1 has been achieved for the VIIRS land surface phenology product.
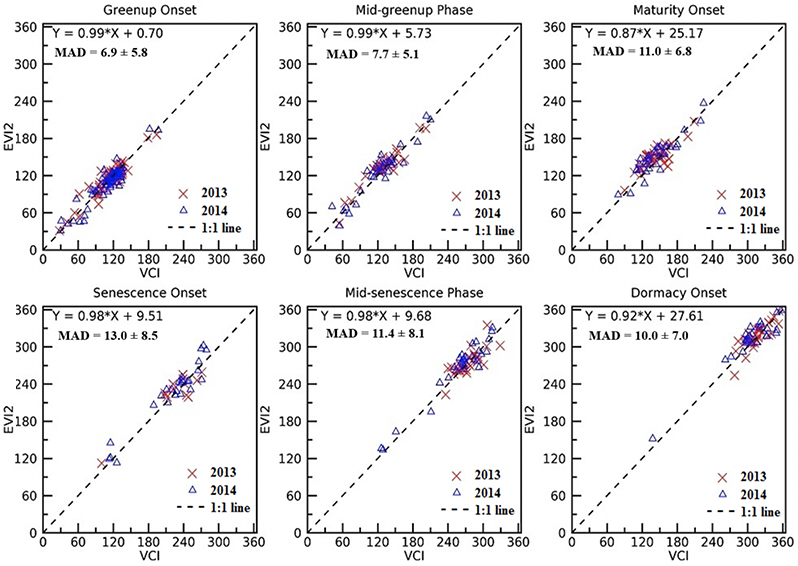
Figure 1. Comparison of phenology transition dates (DOY) between PhenoCam vegetation contrast index (VCI) and
VIIRS EVI2 estimates in 2013 and 2014.
The VIIRS LSP product consists of six phenological transition dates for a vegetation growing cycle. It has been validated using four different datasets. First, VIIRS LSP is evaluated using observations from the 150 PhenoCam sites across the US in 2013 and 2014. Overall, the mean absolute difference (MAD) between the VIIRS LSP and PhenoCam phenological dates is 7-11 days in the greenup phase and 10-13 days in the senescence phase (Figure 1). The difference is smaller in forests, followed by grasslands and croplands, and then savannas.
Secondly, VIIRS LSP is validated using field species-specific observations from the Pan European Phenological database (PEP725, 9664 site-years) and the USA National Phenology Network (USA-NPN, 3144 site-years) during 2013–2020. The green-up onset dates are directly compared with species-specific timing of leaf out available within in the 3 by 3 VIIRS pixels. The VIIRS greenup onset has a mean absolute difference of 14 days with PEP725 in-situ observations and 11 days with USA-NPN observations in selected deciduous forest sites, and 16 days and 13 days respectively for all in-situ sites (Figure 2).
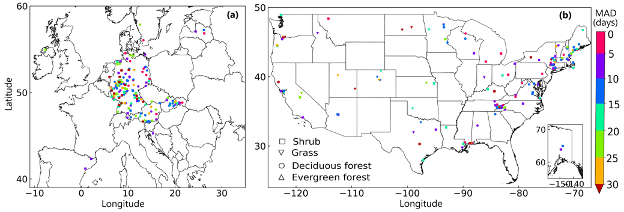
Figure 2. Spatial pattern of mean absolute difference (MAD) between VIIRS greenup onset and in-situ species-specific
observations from 2013–2020: (a) the Pan European Phenological database (PEP725) and (b) the USA National
Phenology Network (USA-NPN). The selected samples meet the criteria that the number of in-situ observed plants
are larger than 3 and in-situ species function types are the same as the MODIS land cover types. On average,
MAD is 14.1 days in deciduous forests and 18.9 days in shrublands across Europe, and it is 10.7 days in deciduous
forests and 13.8 days in shrublands across the USA. Note that in-situ observations spatially mismatch with VIIRS footprints.
And for the third, the dataset used in the validation is a Landsat phenology created from Landsat 7 and Landsat 8 data from two adjacent paths located in the Sierra Nevada Mountains of California, with land cover types of oak/grass savanna, open grassland, and mixed forests. The analysis, based on 20% of the most homogeneous pixels, indicates that the MAD in phenological dates ranges from 4-6 days during the green-up phase and from 8-10 days during the senescence phase (Figure 3).
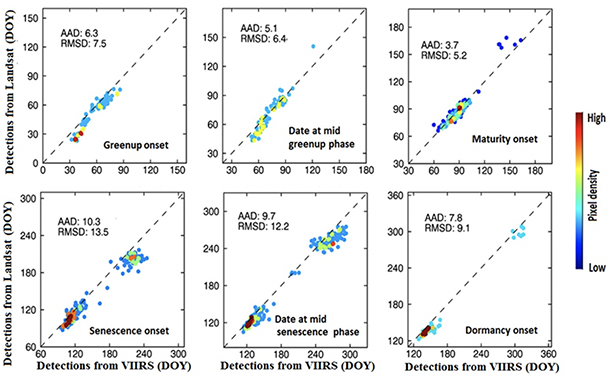
Figure 3. Scatterplots of phenological transition dates detected from Landsat and VIIRS data in the path overlap zone
between Landsat WRS-2 path 43/row 33 and path 44/row 33 in California. Note that the samples are from pixels with
relatively homogeneous phenological dates that differ greatly between grasslands/savannas and forests.
Finally, the VIIRS LSP product is compared with data from the Collection 6 MODIS Land Cover Dynamics (MCD12Q2) product over the most common land cover types in North America. Even though the VIIRS and MODIS products are generated using different instruments and algorithms, phenometrics from each product are similar and show only minor differences within and across land cover types. Systematic differences between phenometrics from the two products were generally less than one week (absolute bias 4.8 ± 3.0 days), and root-mean-square deviations were less than two weeks for most phenometrics across different land cover classes (10.7 ± 4.3 days).
Support Studies
Ye, Y., Zhang, X., Shen, Y., Wang, J., Crimmins, T., Scheifinger, H., 2022, Development of a Prototype Algorithm for Validating
Satellite-derived Land Surface Phenology using in-situ Observations from National Phenology Networks,
Remote Sensing of Environment (under review).
Moon, M., Zhang, X, Henebry, G.M., Liu, L., Gray, J.M., Melaas, E.K., Friedl, M.A., 2019, Long-term continuity in land surface phenology measurements: A comparative assessment of the MODIS land cover dynamics and VIIRS land surface phenology products, Remote Sensing of Environment, 226, 74-92, https://doi.org/10.1016/j.rse.2019.03.034
Zhang, X., Liu, L., Liu, Y., Jayavelu, S., Wang, J., Moon, M., Henebry, G.M., Friedl, M.A., Schaaf, C.B., 2018, Generation and evaluation of the VIIRS land surface phenology product, Remote Sensing of Environment, 216, 212-229, https://doi.org/10.1016/j.rse.2018.06.047
Zhang, X., Jayavelu, S., Liu, L., Friedl, M.A., Henebry, G.M., Liu, Y., Schaaf, C.B., Richardson, A.D., and Gray, J., 2018, Evaluation of Land Surface Phenology from VIIRS Data using Time Series of PhenoCam Imagery, Agricultural and Forest Meteorology, 256–257, 137-149. https://doi.org/10.1016/j.agrformet.2018.03.003