
NASA Phenology Product
Product User GuidePI - Xiaoyang Zhang (SDSU)
Product ATDBCo-Is: Mark Friedl (Boston U), Geoffrey Henebry (SDSU))
Collaborators: Crystal Schaaf (UMass), Tomoaki Miura (U of Hawaii)
Development and Validation of a Global Land Surface Phenology Product from NPP VIIRS for EOS-MODIS Continuity
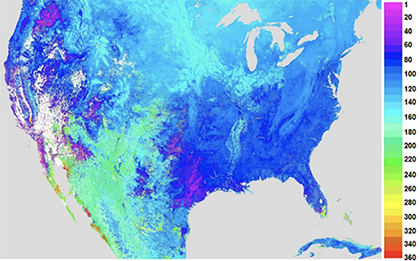
VIIRS phenology product (greenup onset, DOY)
The VIIRS global land surface phenology (GLSP) product aims for a science quality data standard that will enable continuity of a key Earth system data record from the VIIRS time series. This product provides consistent spatial and temporal estimates of the timing and magnitude of phenological development of the vegetated land surface across the globe, that is suitable for characterizing and understanding interannual-to-decadal scale changes in ecosystem responses to changes in the environment. The VIIRS Collection 1 (C1) GLSP product (VNP22Q2), at a spatial resolution of 500m, is produced using an algorithm refined from the Collection 5 MODIS product, which contains twelve phenological metrics (seven phenological dates and five phenological magnitudes), along with six quality assurance metrics characterizing the confidence of phenology retrievals for each pixel. The six phenophase transition dates in the VIIRS GLSP product are closely comparable to PhenoCam observations (Zhang et al., 2017a) and Landsat detections (30m) with a mean absolute difference of less than 10 days (Zhang et al., 2017b).
The VIIRS GLSP algorithm uses as inputs daily VIIRS Nadir BRDF (bidirectional reflectance distribution function)-Adjusted Reflectance (NBAR) data in combination with land surface temperature, snow cover, and land cover type at each pixel. It reconstructs the temporal trajectory of two band enhanced vegetation index (EVI2) to characterize the seasonal variation of land surface greenness using a physically-based hybrid piecewise logistic model:
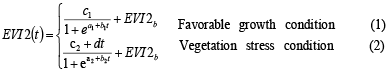
where t is time in the day of year (DOY), a is related to the vegetation growth time, b is associated with the rate of plant leaf development, c is the amplitude of EVI2 variation, d is the vegetation stress factor, and EVI2b is the background value. This model is used to retrieve all the GLSP metrics on an annual basis.
The products are provided in standard Hierarchical Data Format–Earth Observing System (HDF-EOS5) format. Currently, this collection is available from January 19, 2012 and forward. Products from the VIIRS sensor aboard JPSS-1 (J1) will be also be available starting in mid-2023.
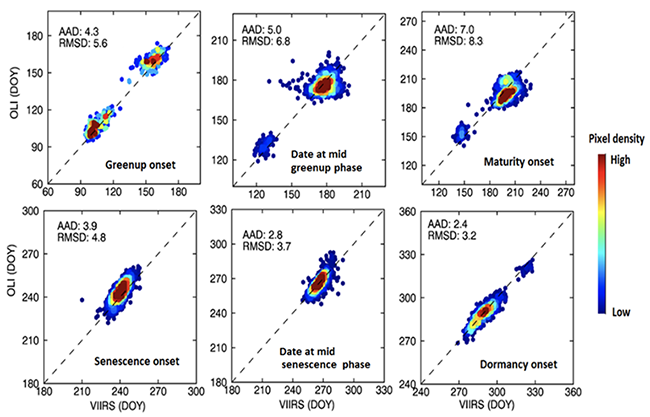
Evaluation of VIIRS GLSP (500m) using fused MODIS-Landsat OLI detections (30m) in 2013 in the central US. AAD is average absolute difference and RMSD is root mean square difference (both units are days).
Product Details and DAAC links
| Product Name | SNPP | JPSS-1 |
|---|---|---|
| Land Surface Phenology Annual L3 Global 500m SIN Grid | VNP22Q2 | VJ122Q2 |
| Land Surface Phenology Annual L3 Global 0.05 Deg CMG | VNP22C2 | VJ122C2 |
References
Zhang, X., Jayavelu, S., Liu, L., Fried, M., Henebry, G., Liu, Y., Schaaf, C., Richardson, A., Gray, J. (2018). Evaluation of land surface phenology from VIIRS data using time series of Phenocam imagery. Agriculture and Forest Meteorology, Volumes 256-257, 15 June 2018, Pages 137-149.
Zhang, X., Liu, L., Liu, Y., Jayavelu, S., Wang, J., Moon, M., Henebry, G.M., Friedl, M.A., Schaaf, C.B., (2018). Generation and evaluation of the VIIRS land surface phenology product, Remote Sensing of Environment, Volume 216, 2018, Pages 212-229, ISSN 0034-4257, https://doi.org/10.1016/j.rse.2018.06.047.
Zhang, X., Wang, J., Gao, F., Liu, Y., Schaaf, C., Friedl, M., Yu, Y., Jayavelu, S., Gray, J., Liu, L., Yan, D., and Henebry, G. (2017b). Exploration of scaling effects on coarse resolution land surface phenology. Remote Sensing of Environment,
http://dx.doi.org/10.1016/j.rse.2017.01.001